Traders use technical analysis to examine market trends, identify patterns, and make well-informed decisions based on market psychology and historical price data. Technical analysts aim to predict future price movements and take advantage of trading opportunities in various financial markets, including stocks, currencies, commodities, and cryptocurrencies by studying charts, indicators, and patterns. We will try to explain and provide:
- Valuable information about technical analysis.
- We are covering core concepts.
- Charting methods.
- Typical patterns.
- Practical strategies that can help investors confidently and accurately navigate the intricacies of the financial markets.
Table of Contents
Understanding Technical Analysis
Technical analysis operates on the premise that past price movements and trading volumes can offer valuable insights to forecast future price trends. It contrasts with fundamental analysis, which delves into a company’s financial statements, industry conditions, and broader economic indicators. Instead, technical analysis utilizes various charts and quantitative indicators to interpret market trends and the psychology of investors.
Basic principles of technical analysis include
1. Price Discounts Everything
According to technical analysts, the price of a security reflects all pertinent information, such as fundamental factors, market sentiment, and news events. Through the analysis of price patterns and trends, technical analysts strive to discover concealed insights and predict future price movements ahead of time.
2. Price Moves in Trends
One of the basic concepts of technical analysis is that prices tend to follow trends, which can be either upward, downward, or sideways movements over a period of time. Technical analysts use trend identification and analysis to take advantage of directional price changes and momentum in the market.
3. History Repeats Itself:
The basis of technical analysis lies in the concept that market cycles and historical price patterns tend to reoccur over time, owing to human psychology and market dynamics. By researching past market behavior and patterns, technical analysts can detect recurring patterns and anticipate similar results in the future.
Charting Techniques and Tools
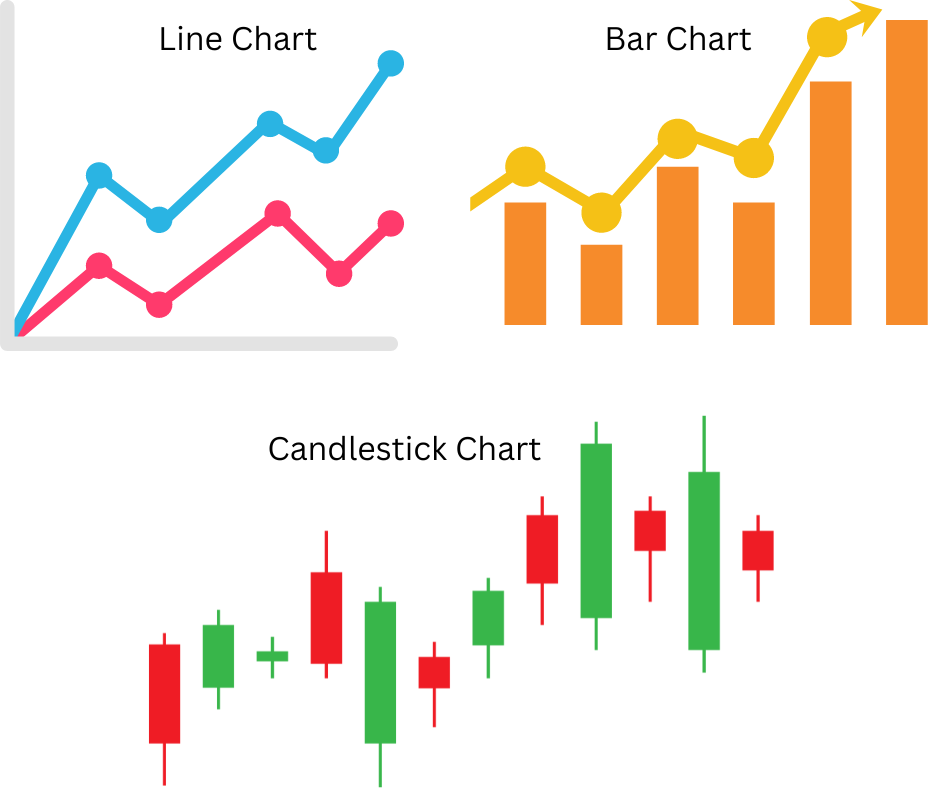
Technical analysis employs charts as the primary means of analysis, which offer graphical depictions of past market trends and price data. Technical analysts commonly use various types of charts, including.
1. Line Charts
A line chart is a visual representation of a security’s closing prices during a specified period, where each data point is connected by a line. Line charts are easy to understand and provide a clear picture of price trends, but they may offer limited information on intraday price fluctuations.
2. Bar Charts
Bar charts represent price data using vertical bars, with each bar indicating the high, low, open, and close prices of a security for a given period. Bar charts can provide more detailed information than line charts and allow traders to visualize price ranges and volatility.
3. Candlestick Charts
Candlestick patterns are used to display price data on candlestick charts, in which each candlestick represents the open, high, low, and close prices of a security for a specific period. These charts can help traders identify trend reversals, support, and resistance levels, and can provide valuable insights into market sentiment.
Technical analysts employ a range of technical indicators and tools to analyze market dynamics and spot trading opportunities. Some of these tools include moving averages, oscillators, trendlines, and chart patterns.
Common Chart Patterns and Signals
Technical analysis heavily relies on chart patterns to gain insights into market sentiment, trend direction, and potential price reversals. Technical analysts use a variety of chart patterns and signals to make decisions. These patterns and signals are crucial in providing valuable information about the market. Some of the most frequently used chart patterns include:
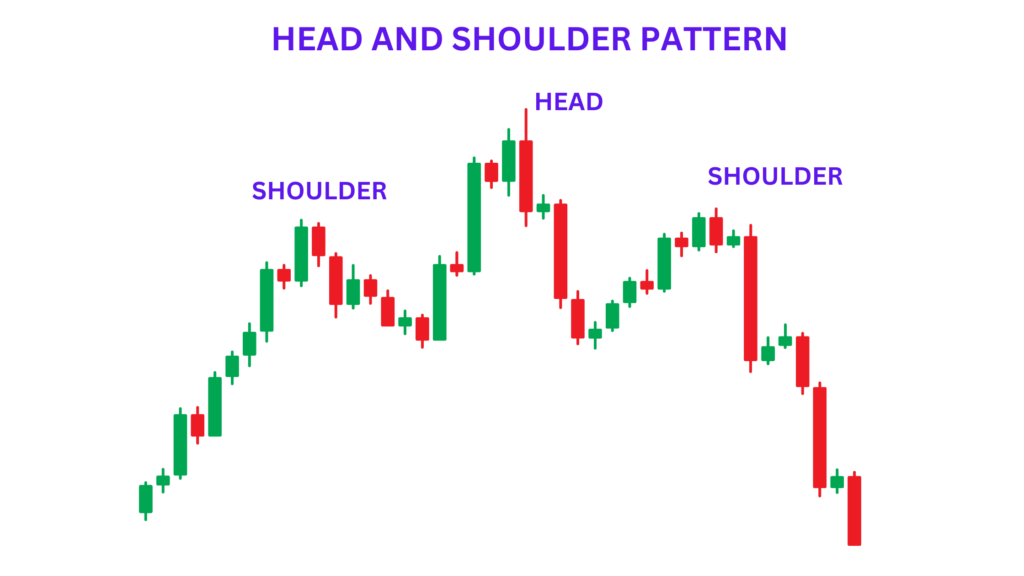
1. Head and shoulders:
A pattern known as head and shoulders is used to indicate a potential trend reversal from bullish to bearish. This pattern usually occurs at the peak of an uptrend and consists of three peaks. The two peaks on the sides are known as shoulders, while the middle peak is called the head. The head is typically higher than the shoulders.
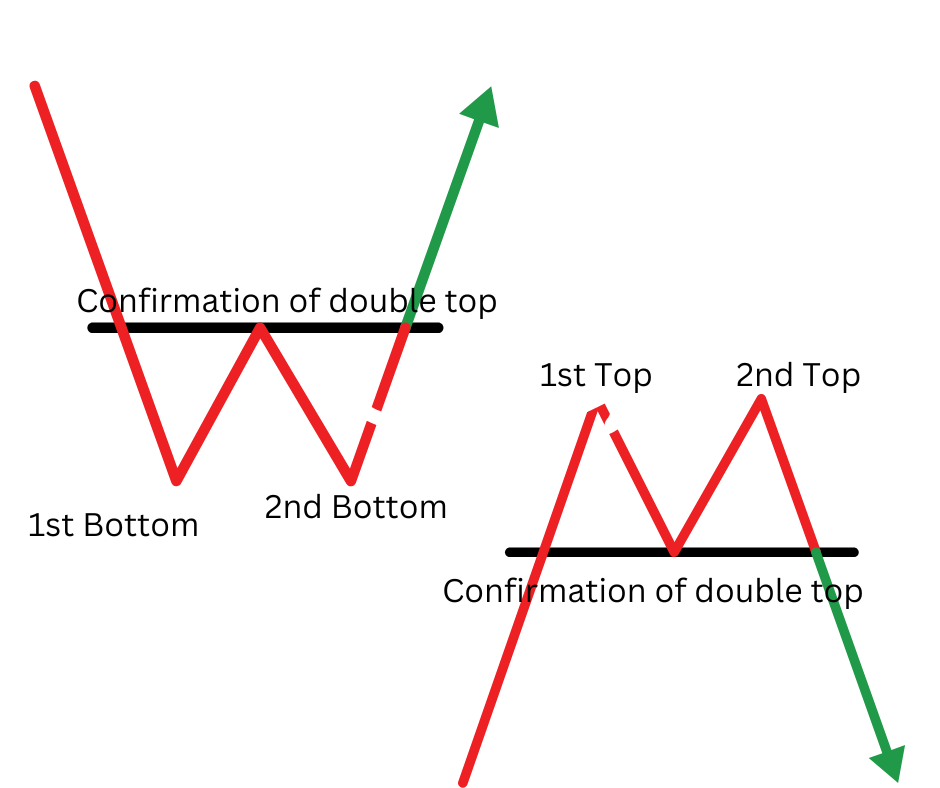
2. Double Top and Double Bottom
The double top pattern is a pattern that signals a potential bearish reversal. It is formed when the price reaches the resistance level twice before heading lower. On the other hand, the double bottom pattern is a pattern that signals a potential bullish reversal. It is formed when the price reaches the support level twice before heading higher.
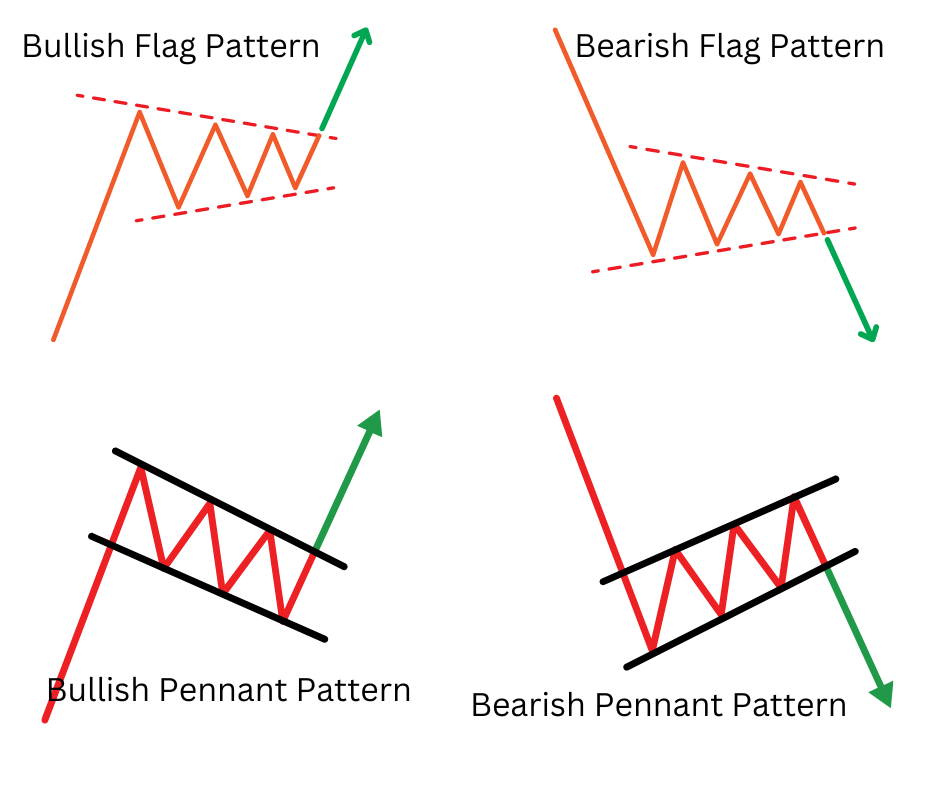
3. Flags and Pennants
Continuation patterns known as flags and pennants tend to occur after a strong price move. They indicate a brief pause or consolidation before the continuation of the prevailing trend. Flags are identified by the presence of parallel trendlines, while pennants are identified by the convergence of trendlines.
Practical Strategies for Technical Analysis
Incorporating technical analysis into your investment strategy requires a systematic approach and disciplined execution. Here are some practical strategies and tips for using technical analysis to make informed investment decisions:
1. Identify Your Trading Style
It’s important to identify your trading style and time horizon, whether you prefer to trade on a daily basis, hold securities for a few days, or invest for the long-term. You should adapt your technical analysis methodology and charting strategies in a way that complements your trading goals and risk appetite..
2. Use Multiple Timeframes
In order to gain a complete understanding of market trends and confirmatory signals, it is recommended to analyze price charts across multiple timeframes, such as daily, weekly, and monthly. You can use longer-term charts to analyze trends and shorter-term charts to determine the timing of entry and exit.
3. Combine Technical Indicators
It’s important to use a variety of technical indicators and tools to confirm signals and validate trading decisions. Relying solely on one indicator is not recommended. To conduct comprehensive analysis, consider using a combination of trend-following indicators, momentum oscillators, and volume-based indicators.
4. Manage Risk Effectively
Managing risk is a crucial aspect of successful investing. To safeguard your capital and minimize potential losses, it’s essential to implement risk management strategies. You can do this by setting stop-loss orders, establishing risk-reward ratios, and diversifying your investments. Technical analysis can also be helpful in identifying important support and resistance levels, which you can use to adjust your trading plan accordingly. By implementing these strategies, you can make informed investment decisions and protect your portfolio from unnecessary risks.
5. Keeping yourself up-to-date is the key
Keeping yourself up-to-date with the latest market updates, economic indicators, and news events that could affect market sentiment and price movements is crucial. Being flexible and modifying your trading strategy and technical analysis approach according to changing market trends and conditions is also very important.
Conclusion
Traders and investors have the ability to use technical analysis to observe market trends, identify patterns, and make informed investment decisions based on historical price data and market psychology. Technical analysis can provide valuable insights by mastering charting techniques, understanding common patterns and signals, and applying practical strategies.
With the help of technical analysis, investors can confidently and precisely navigate the complexities of the financial markets and seize trading opportunities to achieve their financial objectives. Whether you’re a novice investor or an experienced trader, integrating technical analysis into your investment toolkit can improve your ability to reach your financial goals in today’s dynamic and constantly changing market environment.
External resources on Technical Analysis
